
Other meteorological measuring equipment (microwave radiometer, doppler LIDAR and weather mast) continue to collect data with regard to the interesting development of summer
and autumn meteorological conditions this year.
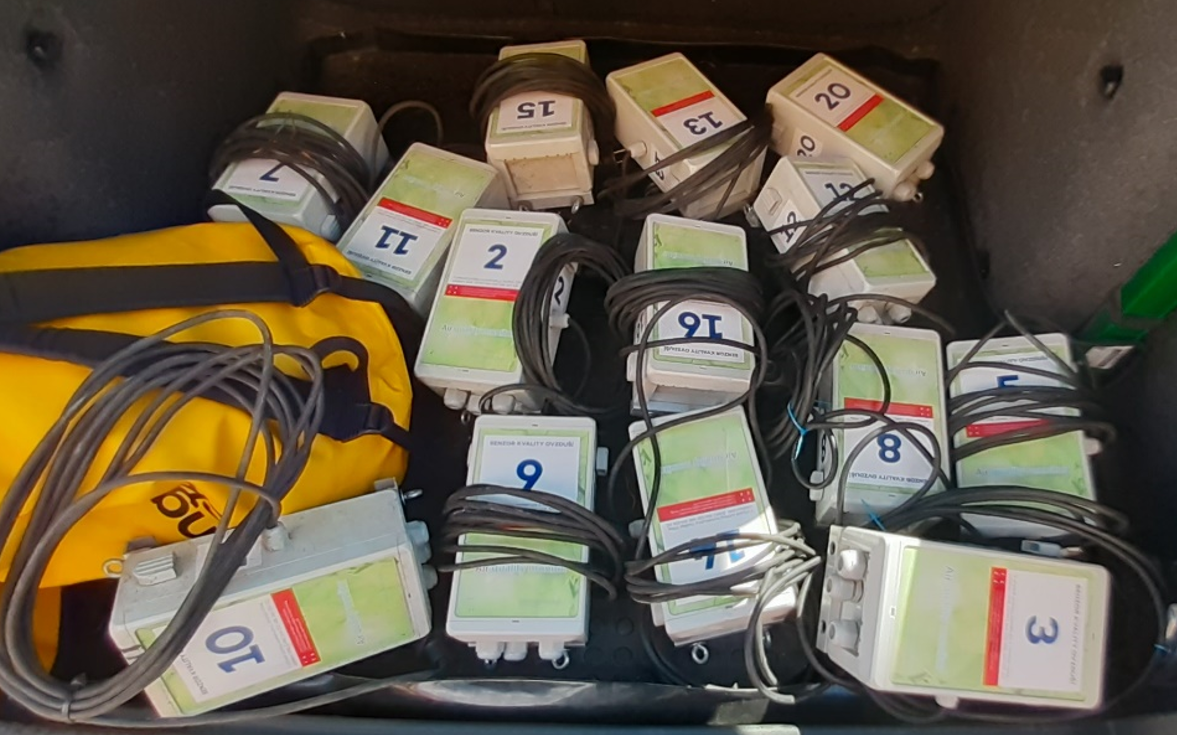 Fig. 1. Dismounted air quality sensors ready for transport to the final comparative measurement at the Praha Libuš reference station.
Due to the fact that low-cost air quality sensors (mainly gas electrochemical sensors) are known for their relatively short lifetime (approx. 1–2 years) and are affected by aging,
including the possibility of random data drifts, a final comparative measurement of all sensors at the Prague Libuš reference station for 35 days was performed after almost 1 year of measurements in the field (Fig. 2).
The aim of the final comparative measurement was to re-evaluate the deviations in the measurement of individual sensors and to compare them with the original deviations determined during the initial comparative measurement
at the same location.
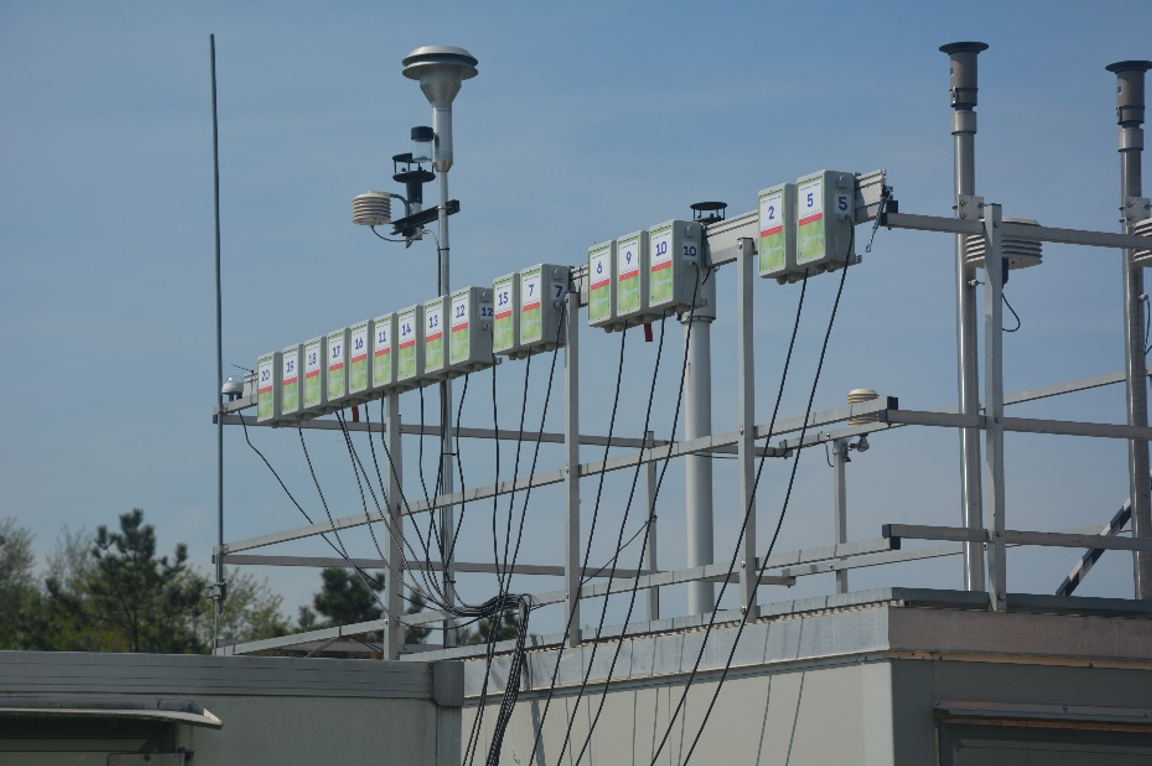 Fig. 2. Final comparative measurement of all air quality sensors at the Prague Libuš location during May and June 2023.
During this final comparative measurement at Prague Libuš reference station, it was found that even after more than a year of operating the sensors in the field, most of them were still capable of relevant measurements (comparable concentration trends), although the individual deviations of the sensors from the reference/control measurement partially increased compared to the comparative measurement at the beginning of the measurement campaign (Figs. 3 and 4).
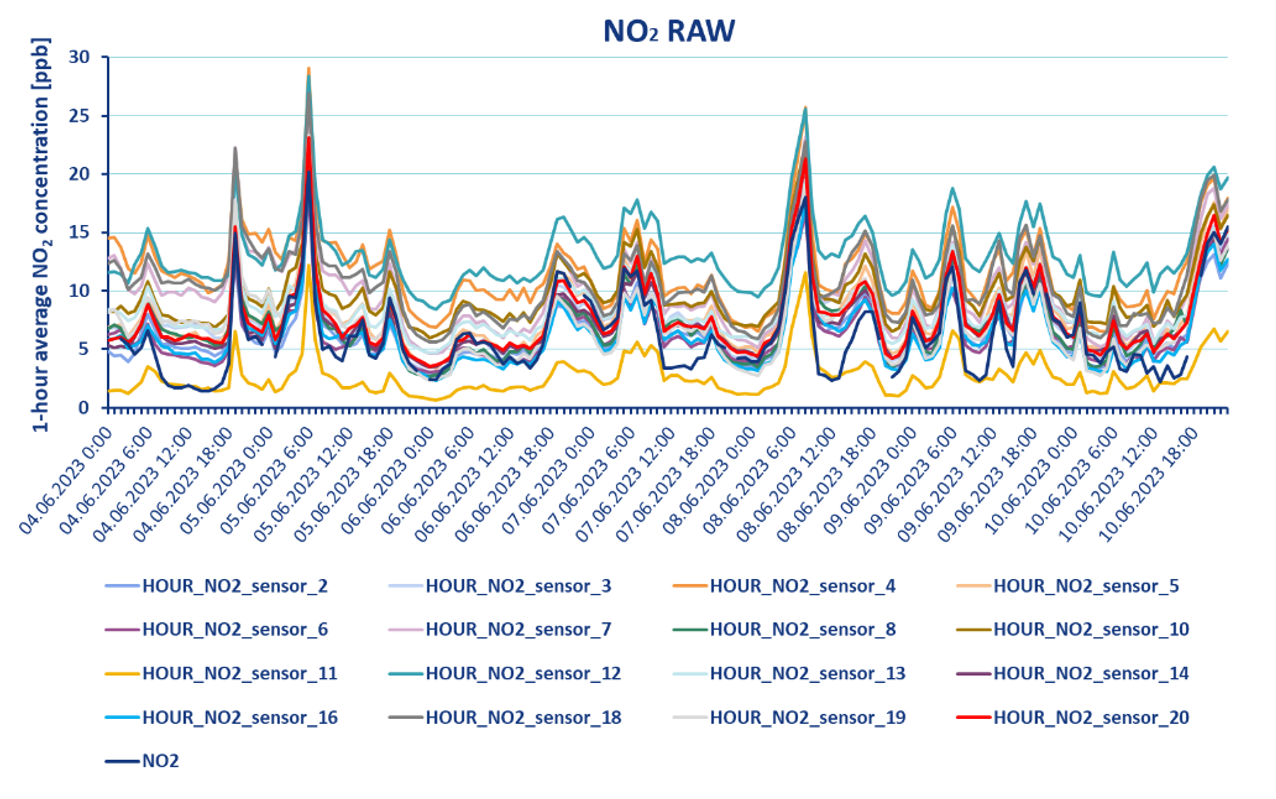 Fig. 3. Raw measured 1hour NO2 concentrations (ppb) during the final comparative measurement at the Prague Libuš reference station (example of data from June 4 to June 10, 2023).
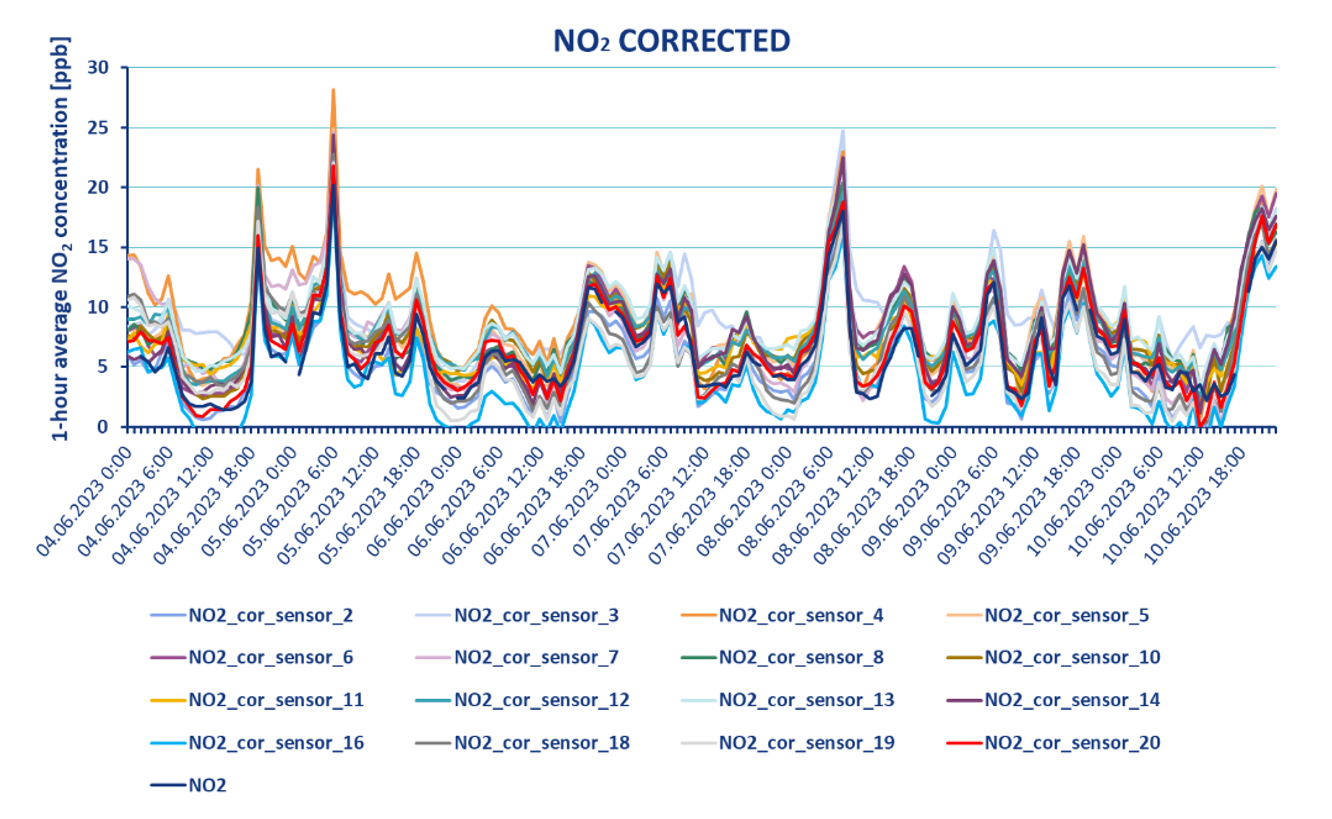 Fig. 4. Corrected 1hour NO2 concentrations (ppb) during the final comparative measurement at the Prague Libuš reference station (example of data from June 4 to June 10, 2023).
The results of the correction are shown in Fig. 2, when the sensors were placed at the initial comparative measurement at the same control location
(reference station Prague Libuš).
The box plot shows the medians and the range of hourly NO2 concentrations measured by individual sensors,
with raw measured data in blue and back-corrected data in red. It can be seen from the graph that the correction achieved equalization of both the medians and the entire range of measured
concentrations for all sensors
Part of the data quality control in case of measurement in Prague 2 was also the evaluation of the correlation of sensor No. 4, which was placed directly at the reference transport station
Praha Legerova during the whole measurement campaign. In this case, the proportion of explained variability in the corrected sensor data when compared to the reference measurement was higher than 90 % (R2 > 0.90; Fig. 5).
For the other sensors, the correlation with the Prague Legerova reference station during the measurement campaign in Prague 2 was weaker, however reasonably, because the other sensors were placed in
different places at different distances from this control measurement. For the other sensors, an important indicator was a similar shape of data relationship (compared to the reference measurement)
within sensors located in pairs at the same location, however at different heights above the ground:
The specific location of particular sensors is shown on the map in Fig. 6.
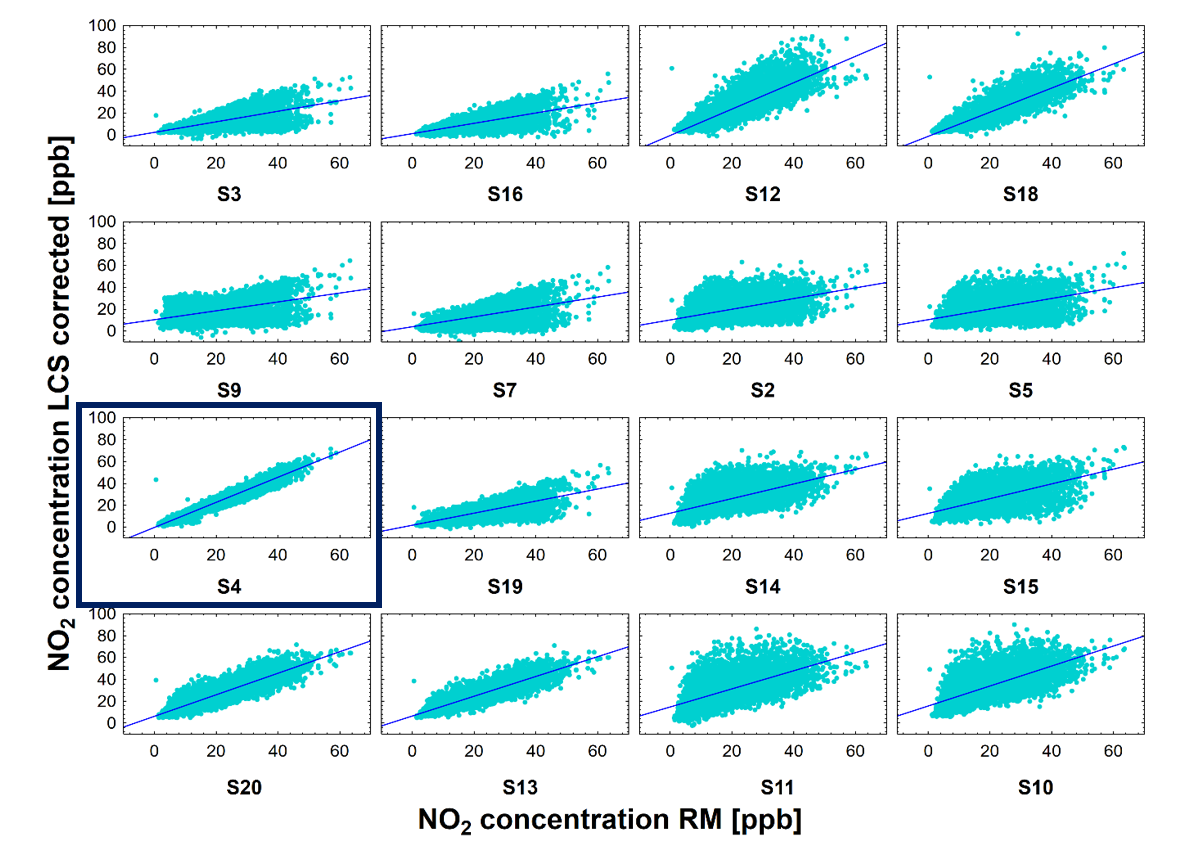 Fig. 5. Correlation of corrected 1hour NO2 concentrations (ppb) with the reference measurement at the Prague Legerova traffic reference station for the entire period of the measurement campaign,
when the sensors were deployed at different locations.
Fig. 5. Correlation of corrected 1hour NO2 concentrations (ppb) with the reference measurement at the Prague Legerova traffic reference station for the entire period of the measurement campaign,
when the sensors were deployed at different locations.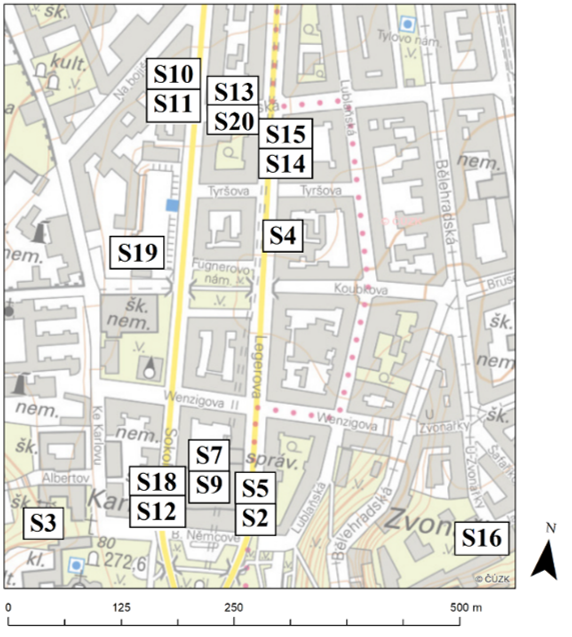 Fig. 6. Map of the location of individual air quality sensors in the field. Double squares with numbers indicate sensors located at one location in two height levels (in indicated order). Source: ČÚZK, CHMI.
A specific issue was a pair of sensors No. 9 and No. 7, both of which were located within a closed school yard (an inner block with a sports field for youth, without the presence of a car park).
Where in case of sensor No. 9 a gradual data drift was detected in the measured concentrations during the measurement campaign (probably caused by aging of the sensor). This erroneous data drift
(to high concentrations) is evident both from the different shape of the correlation of these two sensors with respect to the reference (Fig. 5) and from the difference in the course of concentrations
measured by sensor No. 9 and No. 7 (Fig. 7 and 8). From this point of view, the measurement of NO2 concentrations by sensor No. 9 was evaluated as less relevant than in case of the other sensors.
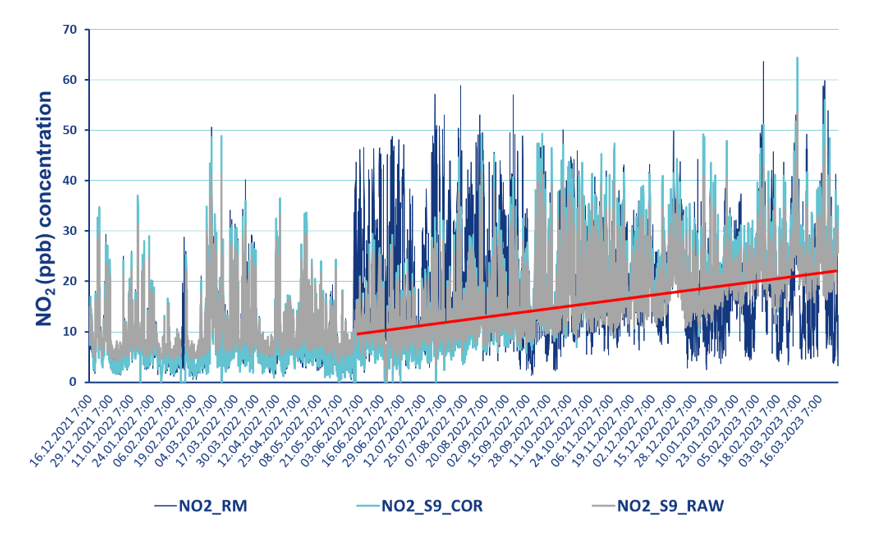 Fig. 7. Detected drift in raw data of sensor No. 9 probably caused by sensor aging.
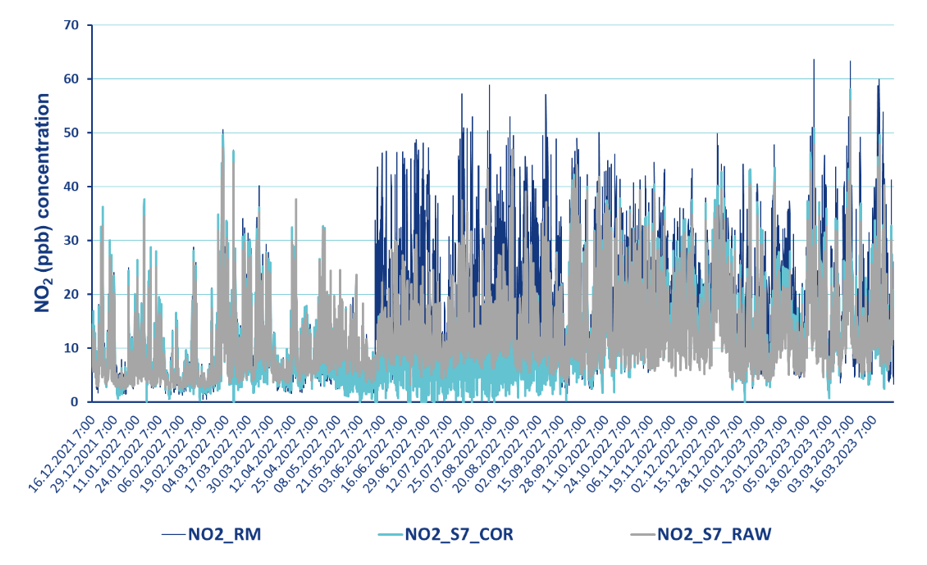 Fig. 8. Concentrations measured by sensor No. 7, which was located at the same place as sensor No. 9 (closed school yard) at a higher height.